
DevOps
How to Use Iotop And Iostat to Diagnose Disk Issues: Expert Tips
Are you frustrated with your computer’s sluggish performance? Disk issues could be the hidden culprits behind the slowdown, affecting your productivity and causing unnecessary stress.
Imagine having the power to diagnose and solve these problems right at your fingertips. With iotop and iostat, you can do just that. These powerful tools are like a magnifying glass for your disk’s activity, helping you uncover what’s really going on beneath the surface.
In this guide, you’ll discover how to use iotop and iostat to gain insights into your system’s performance and tackle those pesky disk issues head-on. Ready to take control of your computer’s efficiency? Let’s dive in and explore how these tools can transform your troubleshooting process.
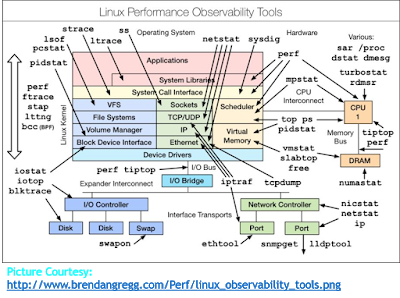
Credit: www.simplylinuxfaq.com
Understanding Disk Performance
Understanding disk performance is crucial for maintaining a healthy system. Disk issues can slow down your computer, affect productivity, and even cause data loss. By using tools like Iotop and Iostat, you can gain insights into how your disks are performing and diagnose potential problems. Let’s explore how these tools can help you understand your disk performance better.
What Is Disk Performance?
Disk performance refers to how efficiently your storage device reads and writes data. It’s an indicator of how well your system can handle tasks that require disk access. If your disk performance is poor, you might notice slower application load times or delays in accessing files.
Several factors influence disk performance. These include disk speed, fragmentation level, and the type of storage (SSD vs. HDD). Understanding these factors can help you pinpoint issues and improve your system’s efficiency.
Why Monitor Disk Performance?
Monitoring disk performance helps you prevent potential problems. Regular checks can alert you to issues before they become serious. You can avoid downtime by addressing problems early.
Imagine working on a critical project when suddenly your system slows down. By monitoring disk performance, you can prevent such scenarios and ensure smooth operation. Regular monitoring also helps you make informed decisions about hardware upgrades.
How Iotop And Iostat Aid In Monitoring
Iotop and Iostat are powerful tools for analyzing disk activity. Iotop helps you track processes that consume disk bandwidth, while Iostat provides statistics on I/O operations and CPU usage. Together, they offer a comprehensive view of your system’s performance.
With Iotop, you can identify processes that are hogging disk resources. It’s like having a magnifying glass to spot the culprits slowing down your system. Iostat, on the other hand, gives you detailed reports on disk usage, helping you understand patterns and trends.
Practical Tips For Using Iotop And Iostat
Start with installing these tools on your system. Most Linux distributions have them available in their package managers. Once installed, familiarize yourself with their basic commands.
Use Iotop to monitor active processes and identify any abnormal disk usage. Look for processes with high I/O rates and investigate further. With Iostat, focus on the average wait times and CPU utilization to gauge performance.
Experiment with different options and flags to customize the output. This will help you tailor the information to your needs. Regular monitoring can help you spot trends and make data-driven decisions.
Engage With Your Findings
After gathering data, analyze it to find actionable insights. Are certain applications consuming more resources than expected? Is there a pattern of high disk usage at specific times?
Use this information to optimize your system. Consider upgrading your hardware or adjusting software settings to enhance performance. Engaging with your findings can empower you to take control of your system’s health.
Are you ready to start monitoring your disk performance? What surprises might you discover about your system’s efficiency? Dive into the world of Iotop and Iostat, and equip yourself with the knowledge to keep your system running smoothly.
Introducing Iotop And Iostat
Disk issues can be a real headache, especially when your system’s performance is on the line. But fear not, tools like Iotop and Iostat are here to help you diagnose these problems effectively. These powerful utilities provide insights into disk usage and performance, enabling you to pinpoint the root cause of any issues. Let’s dive into how you can leverage these tools to keep your system running smoothly.
What Is Iotop?
Iotop is a handy tool for monitoring disk input/output usage by processes in real-time. It provides a clear view of how different processes consume disk resources. This allows you to identify which processes are causing your disks to slow down.
Imagine you’re working on a crucial project, and suddenly, your system lags. By running Iotop, you quickly see that a backup process is hogging the disk. You can then decide to pause or reschedule it, ensuring your work isn’t disrupted.
How Does Iostat Work?
Iostat stands out by offering detailed statistics about disk input/output operations. It helps you understand the overall performance of your disk subsystems. Unlike Iotop, which focuses on processes, Iostat gives a broader view of system performance.
For instance, if your server is underperforming, Iostat can reveal if your disks are the bottleneck. By analyzing the data, you can make informed decisions, like upgrading your disks or optimizing your workload distribution.
Why Use Both Tools Together?
Using Iotop and Iostat together gives you a comprehensive picture of disk performance. While Iotop highlights specific processes causing issues, Iostat provides a bird’s eye view of disk activities. This combination allows you to diagnose both micro and macro-level disk issues.
Think of it as having both a magnifying glass and a telescope for your disk performance. You can zoom in on particular problems and also see the bigger picture. This dual approach ensures you address all potential issues, keeping your system optimized.
Getting Started With Iotop And Iostat
Installing and using these tools is straightforward. Most Linux distributions have them available in their package managers. Once installed, running them is as simple as typing iotop or iostat in your terminal.
Don’t wait until disk issues disrupt your work. Make it a habit to monitor your system regularly. By staying proactive, you ensure a smooth and efficient computing experience. What steps will you take today to better manage your disk performance?
Installing Iotop And Iostat
Diagnose disk issues effectively using Iotop and Iostat tools. Iotop helps monitor real-time disk usage by processes. Meanwhile, Iostat provides detailed statistics on CPU and disk I/O activities, aiding in pinpointing performance bottlenecks.
When your system’s performance starts to lag, it can be frustrating and disruptive. Disk issues often lie at the heart of these performance woes. Installing tools like Iotop and Iostat can be a game-changer in diagnosing these issues. By understanding how to effectively install these tools, you take a significant step towards resolving disk-related problems.System Requirements
Before jumping into the installation, ensure your system meets the necessary requirements. Both Iotop and Iostat are primarily designed for Linux systems. Ensure your distribution is up-to-date for a smoother installation process. If you’re unsure about your current setup, a simple command like `uname -a` can provide insights into your system’s version and architecture.Installation Steps
1. Update Your System: Before installing any new software, it’s good practice to update your package manager. Run `sudo apt-get update` for Debian-based systems or `sudo yum update` for Red Hat-based systems. 2. Install Iotop: For Debian-based systems, enter `sudo apt-get install iotop`. Red Hat users can use `sudo yum install iotop`. The installation is quick and should be free of complications. 3. Install Iostat: Iostat is part of the `sysstat` package. Install it using `sudo apt-get install sysstat` for Debian or `sudo yum install sysstat` for Red Hat. Post-installation, ensure the service is active with `sudo service sysstat start`. 4. Verify the Installation: Check if Iotop is ready by typing `iotop` in your terminal. For Iostat, type `iostat -x`. If both commands return data without errors, you’re good to go. Have you ever installed a tool expecting it to solve all your problems, only to find out it wasn’t functioning due to a missed step in installation? Double-checking these steps ensures you avoid such pitfalls. By following these straightforward steps, you equip yourself with powerful diagnostic tools ready to tackle disk issues head-on. Now that Iotop and Iostat are installed, are you prepared to delve into understanding disk performance metrics?Monitoring Disk Usage With Iotop
Monitoring disk usage is crucial for maintaining system performance. Iotop is a handy tool that helps track disk activity in Linux environments. It provides real-time insights into which processes are using the most I/O resources. This can be invaluable in diagnosing disk bottlenecks and optimizing disk usage.
Basic Commands
To start using Iotop, first ensure it is installed on your system. Use the command sudo apt-get install iotop for Debian-based systems. Launch Iotop with sudo iotop. This will display a list of processes and their disk usage.
Iotop can be customized with various options. Use sudo iotop -o to show only processes currently using disk I/O. To sort by disk usage, add the -P flag. This presents a cleaner view of active processes.
Interpreting Results
Iotop’s interface displays several columns. PID shows the process ID. Command indicates the name of the process. DISK READ and DISK WRITE columns track the amount of data read or written.
Focus on processes with high disk usage. These might be slowing down your system. Compare the values to typical usage patterns. Unusually high numbers may indicate an issue.
Use this information to identify the source of disk bottlenecks. Adjust or terminate problematic processes. This will help improve system performance.
Analyzing Disk Performance With Iostat
Analyzing disk performance with iostat helps identify system bottlenecks. This tool provides detailed reports on disk usage. It helps users understand how disks are performing. By using iostat, you can pinpoint areas needing improvement. This aids in optimizing overall system health.
Key Metrics To Watch
Iostat provides various metrics that are crucial for analysis. The tps metric indicates transfers per second. It shows how often data is moved. kB_read/s and kB_wrtn/s measure read and write rates. These metrics reveal the speed of data processing. High values might suggest excessive disk activity.
Another important metric is await. It represents the average wait time for I/O operations. Long await times can indicate slow disk performance. Monitoring these metrics helps in diagnosing disk-related issues.
Advanced Options
Iostat offers advanced options for deeper insights. The -x flag provides extended statistics. It includes detailed information on disk utilization. The -d option focuses on specific devices. This allows users to assess individual disk performance.
Using -c provides CPU statistics alongside disk data. This helps users correlate CPU and disk activities. These advanced options enhance the diagnostic capabilities of iostat. They allow for comprehensive analysis of disk performance.
Common Disk Issues Identified
When your computer’s performance takes a nosedive, disk issues might be the culprit. Tools like iotop and iostat can help identify these problems. Let’s explore some common disk issues that these tools can reveal, so you can troubleshoot effectively.
High I/o Wait Times
High I/O wait times can slow down your system drastically. This occurs when your CPU spends excessive time waiting for disk operations to complete. You might notice sluggish software response or lagging file transfers.
Using iotop, you can easily spot which processes are causing these delays. Perhaps you’ve experienced this during a crucial work deadline. Identifying these troublesome processes allows you to take immediate corrective actions like closing unnecessary applications.
What steps will you take to minimize I/O wait times in your system? Regular maintenance and updates might be a good start.
Unusual Activity Patterns
Unusual activity patterns can indicate underlying disk issues. These could manifest as unexpected spikes in disk usage or processes that run at odd hours. Such patterns might be the result of misconfigured software or even malicious activity.
iostat provides insights into these irregularities by showing detailed disk utilization statistics. For example, you may notice constant disk access even when your system is idle. This data helps you pinpoint and rectify the root cause of the problem.
Have you ever wondered why your disk usage suddenly spikes? Understanding these patterns can save you from potential headaches.
By leveraging the power of iotop and iostat, you can efficiently diagnose and address disk issues. These tools offer actionable insights, ensuring your system runs smoothly. What will you do today to optimize your disk performance?
Expert Tips For Effective Diagnosis
Diagnosing disk issues becomes straightforward with iotop and iostat tools. Iotop helps monitor disk usage by processes, providing insights into resource-hungry applications. Iostat offers detailed performance statistics, allowing you to spot bottlenecks and enhance disk performance. These tools simplify identifying and resolving disk-related problems effectively.
Diagnosing disk issues can be a daunting task, but with the right tools and techniques, you can make it manageable and efficient. Iotop and Iostat are your go-to tools for such tasks, offering detailed insights into disk usage and performance. But how can you use these tools more effectively? Let’s dive into some expert tips that can help you master the art of disk diagnosis. ###Combining Tools For Better Insights
Using Iotop and Iostat together can provide a comprehensive picture of your disk’s health. Iotop lets you see real-time disk activity by process, while Iostat provides detailed statistics about disk operations over time. Imagine you’re troubleshooting a slow server. Iotop shows which processes are consuming the most I/O resources, while Iostat reveals patterns and trends in disk usage. Combining these insights can help pinpoint if a specific process is causing the slowdown or if it’s a systemic issue. Consider setting up scripts that periodically run both tools. This way, you can correlate data and make informed decisions. This approach can transform vague symptoms into actionable tasks. ###Regular Monitoring Practices
Consistent monitoring is key to identifying disk issues before they escalate. Implementing regular checks with Iotop and Iostat can save you from unexpected failures. Set a schedule to review Iostat reports daily or weekly. This habit allows you to catch trends early, like increasing disk wait times or fluctuating CPU usage related to I/O operations. Iotop can be used to spot anomalies in real-time. If you notice any unusual spikes, investigate them immediately. This proactive step can prevent downtime and maintain system efficiency. How often do you review your disk health? Regular monitoring practices ensure that your system runs smoothly and efficiently, minimizing disruptions to your workflow. Engaging with these tools using these expert tips can turn the complex task of diagnosing disk issues into a straightforward process. Start leveraging Iotop and Iostat effectively today, and take control of your disk performance challenges with confidence.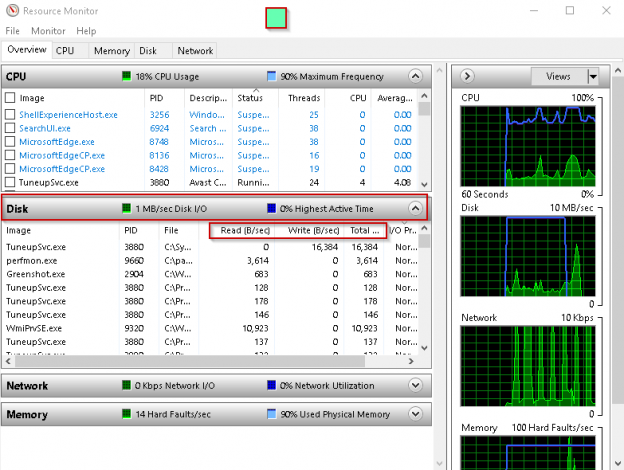
Credit: www.sqlshack.com
Troubleshooting And Solutions
Diagnosing disk issues becomes simpler with iotop and iostat. Iotop helps track real-time disk usage by processes. Iostat provides detailed input/output statistics. These tools offer clear insights, helping pinpoint and resolve disk performance problems efficiently.
Troubleshooting and solving disk issues can be daunting, especially when you’re trying to pinpoint the root cause. Tools like Iotop and Iostat offer invaluable insights into disk usage and performance, making them essential for diagnosing problems. Whether you’re a seasoned sysadmin or a curious beginner, understanding how to utilize these tools effectively can save you time and frustration.Addressing Identified Problems
Once you’ve used Iotop and Iostat to identify disk issues, the next step is tackling these problems head-on. If your data reveals high I/O wait times, consider optimizing your applications or offloading tasks to less busy times. Isolating heavy disk users and adjusting their processes can dramatically improve performance. Sometimes, the issue might be a specific application hogging resources. You can limit its usage or find a more efficient alternative. This not only alleviates current problems but also enhances overall system stability. Disk space can also be a culprit. Regularly clean up unnecessary files and ensure you’re not running out of space. Do you remember a time when freeing up space made your computer run faster? The same principle applies here.Preventive Measures
Prevention is better than cure, especially with disk management. Set up regular monitoring using Iotop and Iostat to catch potential issues before they escalate. This proactive approach can save you from unexpected system slowdowns. Regular system updates are crucial. They often include performance improvements and bug fixes that can mitigate disk-related issues. Have you ever skipped an update and later found out it could have solved your problem? Staying updated is key. Lastly, educate your team or users about efficient resource usage. Encourage practices like saving files in the cloud or using external storage for large media. This not only prevents disk congestion but also maximizes available resources. Incorporating these strategies ensures smoother system operations and prolongs the life of your hardware. How will you implement these solutions in your day-to-day work?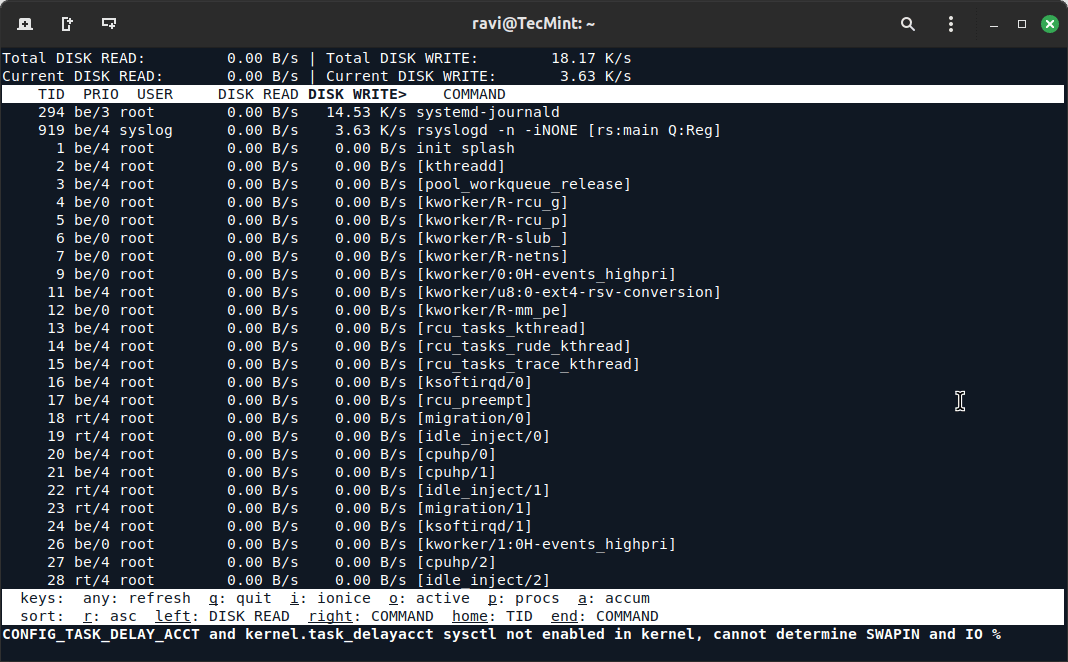
Credit: www.tecmint.com
Frequently Asked Questions
What Is Iotop Used For?
Iotop is a tool that helps monitor disk I/O usage by processes. It provides insights into which processes are consuming disk resources. This information is crucial for diagnosing disk performance issues and ensuring efficient system operation.
How Does Iostat Help Diagnose Disk Issues?
Iostat provides statistics on CPU and disk I/O performance. It helps identify disk bottlenecks and analyze system performance. By monitoring these metrics, you can pinpoint disk-related issues and take corrective actions promptly.
Can I Use Iotop And Iostat Together?
Yes, using Iotop and Iostat together offers a comprehensive view of disk performance. Iotop monitors real-time I/O usage, while Iostat provides historical data. Combining both tools enhances your ability to diagnose and resolve disk issues effectively.
How Do I Install Iotop And Iostat?
To install Iotop and Iostat, use your system’s package manager. On Debian-based systems, use `apt-get install iotop sysstat`. For Red Hat-based systems, use `yum install iotop sysstat`. Ensure you have administrative privileges to install these tools.
Conclusion
Diagnosing disk issues becomes simpler with Iotop and Iostat. Both tools offer valuable insights into disk activity. Iotop helps monitor processes using disk resources. Iostat provides real-time disk performance data. Together, they assist in identifying problem areas. Regular use improves system health.
Understand disk usage patterns better. Address potential issues early. Ensure smoother operations. These tools are straightforward and effective. No need for advanced skills. Anyone can benefit from them. Start using Iotop and Iostat today. Keep your system running efficiently. Optimize performance and prevent unexpected downtime.
-

 DevOps7 years ago
Saltstack Tutorial for beginners [2025]
-

 DevOps7 years ago
How to build a Docker cron job Container easily [2025]
-

 Linux7 years ago
mail Command in Linux/Unix with 10+ Examples [2025]
-

 DevOps7 years ago
Docker ADD vs COPY vs VOLUME – [2025]
-
 DevOps6 years ago
How to setup Pritunl VPN on AWS to Access Servers
-

 Linux7 years ago
Grep Command In Unix/Linux with 25+ Examples [2025]
-

 Linux7 years ago
Find command in Unix/Linux with 30+ Examples [2025]
-
Linux6 years ago
How To setup Django with Postgres, Nginx, and Gunicorn on Ubuntu 20.04