
DevOps
How to Analyze Performance With Perf: Expert Tips
Unlocking the true potential of your system’s performance can feel like unraveling a complex puzzle. Yet, having the right tools at your disposal makes all the difference.
Have you ever wondered if your applications are running as efficiently as possible or if there’s hidden room for optimization? Imagine being able to pinpoint precisely where your system’s resources are being consumed, and making informed decisions to boost your productivity.
This is where Perf steps in—a powerful tool that can transform the way you analyze and enhance performance. You’ll discover how to harness the capabilities of Perf to gain invaluable insights and optimize your system’s performance like never before. Stay with us, and learn how to turn data into actionable strategies that can propel your work to new heights.

Credit: www.youtube.com
Getting Started With Perf
Getting started with Perf might seem daunting at first, but fear not. Perf is a powerful tool for analyzing performance metrics in Linux systems. It’s like having a magnifying glass to inspect the inner workings of your system, helping you pinpoint areas that need improvement. Whether you’re a developer wanting to optimize code or an administrator trying to enhance system efficiency, Perf can be your go-to solution.
Installing Perf
Before you can dive into using Perf, you need to install it. Thankfully, it’s quite straightforward. Depending on your Linux distribution, you might already have it installed. If not, use your package manager to get it.
- For Ubuntu, type:
sudo apt-get install linux-tools-common linux-tools-generic - On Fedora, use:
sudo dnf install perf
Check the version installed using perf --version. This ensures you’re working with the latest features. If you encounter issues, verify your kernel version for compatibility. Sometimes, a kernel upgrade can resolve unexpected hiccups.
Basic Commands
Once Perf is installed, familiarize yourself with some basic commands. Start simple; you don’t have to be an expert immediately. A good starting point is the perf list command, which displays all available events. This helps you understand what you can monitor.
Try perf stat to gather general statistics about your system. This command provides insights into CPU cycles, instructions, cache references, and more. It’s like getting a snapshot of your system’s heartbeat.
Wondering how your application performs under stress? Use perf record followed by your application command. This records the performance data, which you can analyze later with perf report. It’s a bit like taking notes during a lecture—you capture details for deeper analysis later.
What specific performance metric are you curious about? Perf can likely measure it. Dive into the documentation as you familiarize yourself with these commands. Experimentation is key to mastering Perf. Keep trying different commands to see what insights you can uncover.
Key Features Of Perf
Perf offers essential tools for analyzing performance efficiently. It monitors CPU usage, tracks system calls, and identifies bottlenecks. With Perf, pinpointing issues in applications becomes straightforward and effective.
Analyzing performance with Perf can be a game-changer for anyone looking to optimize their system’s efficiency. Perf is a powerful tool that provides deep insights into how your programs and applications are running. Understanding its key features will help you make the most of this tool. ###Event Monitoring
Perf allows you to monitor specific events during program execution. This feature is essential for understanding what happens when your code runs. You can set up Perf to track events like cache misses, branch mispredictions, or CPU cycles. Consider the last time your application ran slower than expected. By monitoring these events, you can pinpoint where things went wrong. Are you curious about how often your application misses cache? Perf can tell you that. ###Sampling And Counting
With Perf’s sampling and counting capabilities, you can gather data over time or count specific occurrences. Sampling provides a snapshot of your application’s performance at regular intervals. Counting, on the other hand, tracks how often certain events happen. Imagine you’re troubleshooting a CPU bottleneck. Sampling can reveal which functions consume the most CPU time. Counting can show how many times a function is called. This dual approach offers a comprehensive view of performance. ###Performance Counters
Perf utilizes hardware performance counters to provide detailed insights. These counters track low-level operations like instructions executed or cache lines loaded. Understanding these metrics can lead to significant performance improvements. For example, if you notice high cache line loads, it might be time to review your data structures. Are they optimized for cache usage? Performance counters reveal such inefficiencies. Incorporating Perf into your analysis routine can transform how you optimize applications. Which feature will you explore first?Advanced Analysis Techniques
Explore how to analyze performance with Perf by using advanced techniques to monitor system activity efficiently. Perf provides detailed insights into CPU usage, memory, and network performance. It helps identify bottlenecks and optimize processes for better system functionality.
Analyzing the performance of your applications can be a game-changer. It allows you to understand where your system is thriving and where it needs attention. Perf, a powerful Linux profiling tool, offers advanced techniques to help you get the most out of your analysis. You’ll gain insights into CPU usage, memory usage, and I/O performance. These insights are invaluable in optimizing your system’s efficiency. Let’s dive into these advanced analysis techniques.Analyzing Cpu Usage
Understanding CPU usage is crucial for optimizing performance. Perf provides various commands to help you identify CPU bottlenecks. You can track the number of cycles, instructions, and cache misses. By doing so, you’ll know which processes are consuming the most CPU resources. This information can guide you in redistributing tasks or upgrading hardware to improve performance.Memory Profiling
Memory issues can cripple your application’s performance. Perf allows you to perform memory profiling to identify leaks and inefficient usage. You can analyze heap usage and track memory allocation patterns. This helps in pinpointing areas where memory is wasted. By addressing these issues, you can enhance your application’s speed and responsiveness.I/o Performance Insights
I/O operations often become a bottleneck in system performance. Perf provides insights into your system’s I/O operations. You can measure disk read/write speeds and identify latency issues. This data is essential for optimizing data storage and retrieval processes. Are your disk operations slowing down your application? With Perf, you can answer this question and take action to streamline I/O performance. Analyzing performance with Perf isn’t just about data collection; it’s about transforming insights into actions. As you leverage these advanced techniques, you’ll see noticeable improvements in your application’s efficiency. So, why wait? Start using Perf today to optimize your system’s performance.Customizing Perf For Your Needs
Customizing Perf for your needs allows precise performance analysis. Perf is a powerful tool, but sometimes default events may not suit your requirements. Customizing Perf lets you tailor its capabilities to fit specific needs, providing deeper insights into system behavior.
Creating Custom Events
Creating custom events in Perf expands its functionality. Start by defining specific events relevant to your application. Custom events capture targeted data, enhancing performance analysis. Use Perf’s event configuration options to set up these unique events easily. This approach helps monitor particular processes or system aspects, offering a detailed performance view.
Scripting With Perf
Scripting with Perf automates tasks and simplifies data collection. Writing scripts helps manage complex performance monitoring scenarios efficiently. Use scripts to execute Perf commands automatically at desired intervals. This ensures consistent data collection without manual intervention. Automating Perf through scripts saves time and reduces errors, increasing productivity.
Integrating With Other Tools
Integrating Perf with other tools enhances its capabilities. Combine Perf with visualization tools to interpret data better. Use Perf with logging systems to correlate performance metrics with logs. Integration provides comprehensive insights by merging Perf data with other sources. This unified approach helps in understanding system performance holistically.
Interpreting Perf Data
Analyzing performance with Perf involves understanding data from software activities. It helps identify bottlenecks and optimize processes. Gain insights by interpreting metrics and patterns to improve efficiency.
Analyzing performance with Perf can seem daunting at first, but understanding how to interpret its data can transform your approach to optimizing code. Whether you’re a seasoned developer or just dipping your toes into performance analysis, comprehending Perf data is crucial. Let’s dive into how you can make sense of this information and boost your software’s efficiency.Understanding Output
Perf provides a wealth of data that can initially feel overwhelming. Each line of output holds valuable insights into your code’s performance. Focus on key metrics such as CPU usage, cache misses, and execution time. These metrics tell you where your program spends most of its time. By understanding these numbers, you can pinpoint inefficient areas in your code. Keep your eyes peeled for any unusual spikes or numbers that stand out.Visualizing Results
Visualizing Perf data can make complex information more digestible. Tools like Flamegraphs or Perf’s built-in visualization options can help. These tools transform raw data into graphs and charts that are easier to interpret. Imagine seeing your code’s execution path in a colorful graph. It’s like having a roadmap to performance optimization. This visual representation can quickly highlight areas that need attention.Identifying Bottlenecks
Once you’ve got a handle on interpreting and visualizing data, the next step is identifying bottlenecks. Look for functions or processes that take up an excessive amount of CPU time. This is where your performance problems likely lie. Consider the impact these bottlenecks have on your application. Are they causing slowdowns or unresponsiveness? Addressing these areas can lead to significant performance improvements. Isn’t it exciting to think about the potential speed gains you could achieve? With a clear understanding of Perf data, you can make informed decisions that enhance your code’s efficiency. Don’t just take my word for it—try it yourself and see the difference it makes.Credit: www.nvidia.com
Best Practices For Performance Analysis
Analyze performance effectively with Perf by focusing on key metrics and identifying bottlenecks. Utilize Perf’s detailed insights to improve system efficiency and optimize resource allocation. Regularly update your analysis approach to adapt to changing performance demands.
Analyzing performance with Perf can feel overwhelming if you don’t follow best practices. It’s not just about collecting data; it’s about doing it efficiently and understanding what the data tells you. To get the most out of Perf, you need to focus on precise data collection, reduce the performance overhead, and adopt regular monitoring strategies. ###Efficient Data Collection
Gathering data efficiently is crucial for meaningful analysis. Start by clearly defining what performance metrics are important for your application. This can include CPU usage, memory consumption, or disk I/O, depending on your goals. Use Perf’s specific commands to target these metrics. For example, if you’re looking at CPU performance, use `perf stat` to get detailed statistics. This focused approach saves you time and provides clearer insights. Don’t overwhelm yourself with too much data. Collect what you need and ignore what’s irrelevant. This keeps your analysis streamlined and actionable. ###Minimizing Overhead
Performance tools can add overhead if not used carefully. Always test Perf in a controlled environment first to understand its impact on your system. Adjust Perf’s sampling frequency to balance detail with performance. Higher frequencies give more data but can slow down your system. Find the sweet spot where you get enough detail without affecting performance. Think about your daily routines. Just as you wouldn’t run a marathon with heavy boots, don’t let Perf drag down your system. Be mindful of the overhead and make adjustments as necessary. ###Regular Monitoring Strategies
Regular monitoring helps catch performance issues early. Set up a schedule for running Perf, just like regular health check-ups for your car. Automate your data collection to ensure consistency. Use scripts to run Perf at specific intervals, so you never miss important data points. Be proactive. Don’t wait for users to complain before you check performance. Regular monitoring can help you identify trends and anticipate problems before they escalate. Have you ever noticed how a small habit change, like taking the stairs instead of the elevator, can make a big difference in your health over time? Regular, small actions with Perf can lead to significant improvements in your system’s performance. By following these best practices, you’ll find that analyzing performance with Perf becomes not only manageable but also incredibly rewarding.Troubleshooting Common Issues
Understanding how to analyze performance with Perf helps identify bottlenecks. This tool monitors system behavior efficiently, pinpointing issues affecting speed. Simplified data visualization aids in performance improvement.
Analyzing performance with Perf can sometimes feel like navigating a maze. You might encounter hiccups that seem insurmountable. But don’t worry, common issues often have straightforward solutions. Let’s dive into some frequent challenges and how you can overcome them. ###Resolving Data Inconsistencies
Data inconsistencies can throw a wrench in your analysis. Have you ever encountered mismatched data points that just don’t add up? It’s essential to ensure that your data sources are synchronized and correctly formatted. Start by verifying the data collection process. Ensure all your data is coming from reliable sources and double-check timestamps. Consistency in data input is crucial for accurate analysis. You might also want to look at how data is being processed. Misalignment can occur if data is incorrectly parsed. Ensure your parsing scripts or tools are up-to-date and functioning correctly. ###Addressing Compatibility Issues
Compatibility issues can halt your progress. Imagine working with data from different systems that just won’t play nice. It’s a common problem, especially when integrating new tools or software. Ensure your version of Perf is compatible with your system. Regularly update Perf and your operating system to prevent compatibility glitches. Keeping your software up to date can resolve many issues right out of the gate. Don’t forget to check dependencies. Some features may rely on specific libraries or plugins. Make sure these are installed and compatible with your current setup. ###Handling Performance Anomalies
Performance anomalies can be puzzling. Have you ever noticed a sudden drop or spike in performance data without any apparent reason? These anomalies can be due to various factors. First, check for recent changes in your system or network. Did you update any software or hardware components? Such changes can impact performance metrics. Consider the environmental factors. Network congestion or unexpected user behavior can lead to anomalies. Monitoring your system consistently can help you identify patterns and outliers. Lastly, review your analysis parameters. Sometimes, the way data is being interpreted might cause misleading anomalies. Ensure your analysis settings align with your performance goals. In tackling these common issues, remember that each challenge is an opportunity to fine-tune your analysis skills. What strategies have you found effective in resolving these issues? Share your insights and continue the conversation.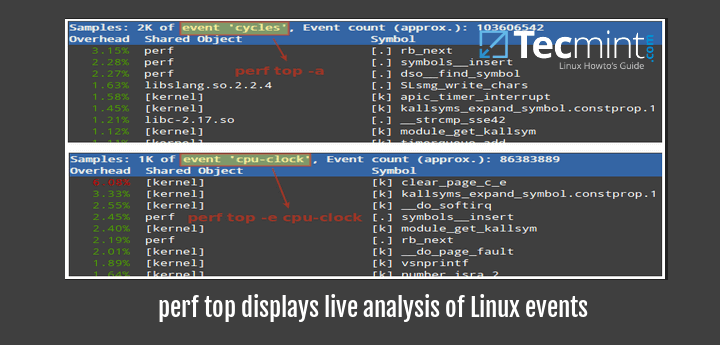
Credit: www.tecmint.com
Frequently Asked Questions
What Is Perf In Performance Analysis?
Perf is a powerful Linux tool used for performance analysis and profiling. It helps identify bottlenecks by monitoring hardware events. By using Perf, developers can track CPU usage, cache misses, and more. It provides detailed insights into system behavior, making performance optimization more effective and efficient.
How Do I Install Perf On Linux?
To install Perf on Linux, use your distribution’s package manager. For Ubuntu, run `sudo apt-get install linux-tools-common linux-tools-generic`. For Fedora, use `sudo dnf install perf`. Ensure your kernel version matches the Perf version. This ensures compatibility and provides accurate performance analysis results.
Can Perf Analyze Cpu Performance?
Yes, Perf can analyze CPU performance effectively. It monitors CPU cycles, cache hits, and memory usage. Perf provides detailed reports on CPU behavior, helping identify inefficiencies. By analyzing these metrics, developers can optimize code for better CPU utilization and performance.
Perf is essential for in-depth CPU performance analysis.
Is Perf Suitable For Beginners?
Perf can be challenging for beginners due to its complexity. However, its powerful features are worth the effort. Beginners should start with basic commands and gradually explore more advanced options. Many online tutorials and resources can help learn Perf. With practice, Perf becomes a valuable tool for performance analysis.
Conclusion
Perf offers a practical way to analyze performance. With simple steps, users can track system behavior effectively. Performance monitoring becomes clear and manageable. Regular use helps identify and resolve issues early. This tool aids in optimizing resources and improving efficiency.
It’s essential for maintaining a healthy system. Understanding Perf gives users control over performance data. Embrace it for better system management. Gain insights and make informed decisions. Keep your system running smoothly with Perf. Use this tool to enhance your performance analysis skills.
Start analyzing and improve your system’s performance today.
-

 DevOps6 years ago
Saltstack Tutorial for beginners [2025]
-

 DevOps6 years ago
How to build a Docker cron job Container easily [2025]
-

 Linux7 years ago
mail Command in Linux/Unix with 10+ Examples [2025]
-

 DevOps7 years ago
Docker ADD vs COPY vs VOLUME – [2025]
-
 DevOps6 years ago
How to setup Pritunl VPN on AWS to Access Servers
-

 Linux7 years ago
Grep Command In Unix/Linux with 25+ Examples [2025]
-

 Linux7 years ago
Find command in Unix/Linux with 30+ Examples [2025]
-
Linux6 years ago
How To setup Django with Postgres, Nginx, and Gunicorn on Ubuntu 20.04