
Linux
How to Monitor System Resources in Linux: Top Tools Explained
Are you struggling to keep track of your Linux system’s performance? Monitoring your system resources is crucial to ensure everything runs smoothly, from avoiding system crashes to optimizing your computing power.
But with so many tools out there, where do you even begin? This guide will walk you through the essentials of monitoring system resources in Linux using three powerful tools: Top, Htop, and Free. Imagine having the ability to pinpoint exactly what’s eating up your CPU, memory, or swap space, giving you the control to fine-tune your system for peak efficiency.
Dive in to discover how these tools can become your best allies in managing your Linux environment.
Credit: linuxblog.io
Importance Of Monitoring System Resources
Monitoring system resources in Linux is crucial for maintaining a smooth and efficient operation. Imagine your computer as a busy kitchen; if you don’t keep track of what’s cooking, you might end up with a burnt meal. Similarly, if you ignore your system’s performance, you might face slowdowns or crashes. By keeping an eye on your resources, you ensure your system runs smoothly, avoiding unexpected disruptions.
Why Monitoring Is Essential
Have you ever wondered why your computer suddenly slows down? Monitoring helps you identify resource hogs like memory or CPU usage. It’s like having a health checkup for your PC. When you know what’s consuming your resources, you can take steps to optimize performance.
Preventing System Overload
System overload can lead to crashes and downtime. By regularly checking your resources, you can prevent these issues before they happen. Think of it as a smoke alarm for your computer; it alerts you before the fire starts. You can manage your processes effectively and avoid overwhelming your system.
Improving Productivity
Efficient systems lead to better productivity. When your system runs smoothly, you can focus more on your tasks and less on troubleshooting. Monitoring helps you maintain this efficiency, ensuring your computer doesn’t become a hindrance. Isn’t it great to work without interruption?
Optimizing System Performance
Optimizing performance is key for any user, whether you’re a tech enthusiast or a casual user. Monitoring resources provides insights into how you can improve your system’s speed and efficiency. It’s like tuning up a car for better mileage; you get more out of your system.
Detecting Unwanted Applications
Sometimes applications consume resources without your knowledge. Monitoring helps you detect these unwanted apps that might be slowing down your system. Have you ever found a program running that you didn’t even open? Identifying and closing such apps can free up valuable resources.
Ensuring Stability
Stability is crucial for any system operation. Monitoring ensures that your system remains stable and reliable. It’s like having a steady ship on a turbulent sea; you’re prepared to handle any storm. Regular checks keep your system from unexpected crashes.
So, what steps will you take to monitor your system resources today? Keeping an eye on your system can save you from a lot of headaches. It’s time to make monitoring a regular habit for your Linux system.
Credit: gridpane.com
Common System Resources To Track
Monitoring system resources in Linux is essential for maintaining performance. Tools like Top, Htop, and Free help track CPU usage, memory consumption, and swap space. Understanding these metrics ensures efficient system operations and optimal resource management.
Monitoring your system resources in Linux is crucial for maintaining a healthy and efficient machine. Whether you’re troubleshooting performance issues or just want to keep an eye on your system’s well-being, understanding what resources to track is key. By focusing on CPU usage, memory utilization, disk I/O, and network activity, you can gain valuable insights into your system’s performance. Let’s dive into these common system resources and see how they can impact your Linux experience.Cpu Usage
CPU usage is a critical metric that tells you how much processing power your system is consuming. High CPU usage can indicate that your system is under heavy load or that a particular process is hogging resources. Tools like Top and Htop provide a real-time view of CPU activity, helping you identify which applications are consuming the most CPU cycles. Consider checking CPU usage regularly to ensure that no single process is affecting your system’s performance.Memory Utilization
Memory utilization reflects how much of your system’s RAM is currently in use. If your system is sluggish, it might be due to high memory usage. The Free command can show you how much memory is being used and how much is available. Have you ever noticed your system slowing down when multiple applications are open? Monitoring memory utilization can help you decide when it might be time to close some programs or add more RAM.Disk I/o
Disk I/O refers to the speed at which data is read from and written to your disk. High disk I/O can slow down your system, especially if the disk is a bottleneck. Use Iotop or similar tools to monitor disk activity and identify processes with high I/O usage. Understanding disk I/O can help you manage large files more efficiently and optimize system performance.Network Activity
Network activity monitoring is essential to ensure that your internet connection is stable and secure. Tools like Ifstat can help you keep track of incoming and outgoing data packets. Have you ever experienced slow internet speeds despite a strong connection? By monitoring network activity, you can detect unusual data spikes or bandwidth issues that might need your attention. By focusing on these key system resources, you can maintain better control over your Linux environment. Regular monitoring helps you react promptly to potential issues, ensuring your system remains smooth and responsive. What resource will you check first today?Overview Of Top Monitoring Tools
Monitoring system resources is crucial for maintaining a healthy Linux environment. Several tools provide insights into CPU usage, memory consumption, and system performance. These tools help in identifying bottlenecks and optimizing resource allocation.
The Power Of Top
Top is a widely-used tool for monitoring system resources. It displays real-time information about running processes, CPU, and memory usage. Users can sort processes by CPU or memory consumption. This helps in pinpointing resource-intensive applications quickly.
Enhanced Visualization With Htop
Htop offers a more user-friendly interface compared to Top. It provides a colorful display and supports mouse interaction. Users can navigate processes easily and perform actions like killing or renicing tasks. Htop is ideal for those who prefer a graphical view.
Memory Insights With Free
Free is a command-line tool focusing on memory usage. It presents detailed information about system memory, swap usage, and available space. Free is straightforward, making it perfect for quick checks on memory status. Users can understand memory allocation without much hassle.
Using Top
Top command helps monitor system resources efficiently in Linux. It displays real-time data on CPU, memory, and process activity. Ideal for identifying resource bottlenecks and optimizing system performance.
Monitoring system resources in Linux can be a game-changer, especially if you’re managing multiple applications or working on complex projects. One of the most powerful tools at your disposal is the “Top” command. This utility gives you real-time insights into what’s happening under the hood of your system. It’s like having an up-to-the-minute report on your system’s health. Many users, myself included, have found Top to be an indispensable ally when troubleshooting slowdowns or resource bottlenecks. ###Installation And Setup
Most Linux distributions come with Top pre-installed. To check if it’s available, simply open your terminal and typetop. If it launches, you’re good to go.
If it isn’t installed, you can easily add it using your package manager. On Ubuntu, use the command sudo apt-get install procps. For Fedora, you would use sudo dnf install procps-ng.
Once installed, just type top in the terminal, and you’ll see a list of processes and their resource usage in real time.
### Key Features
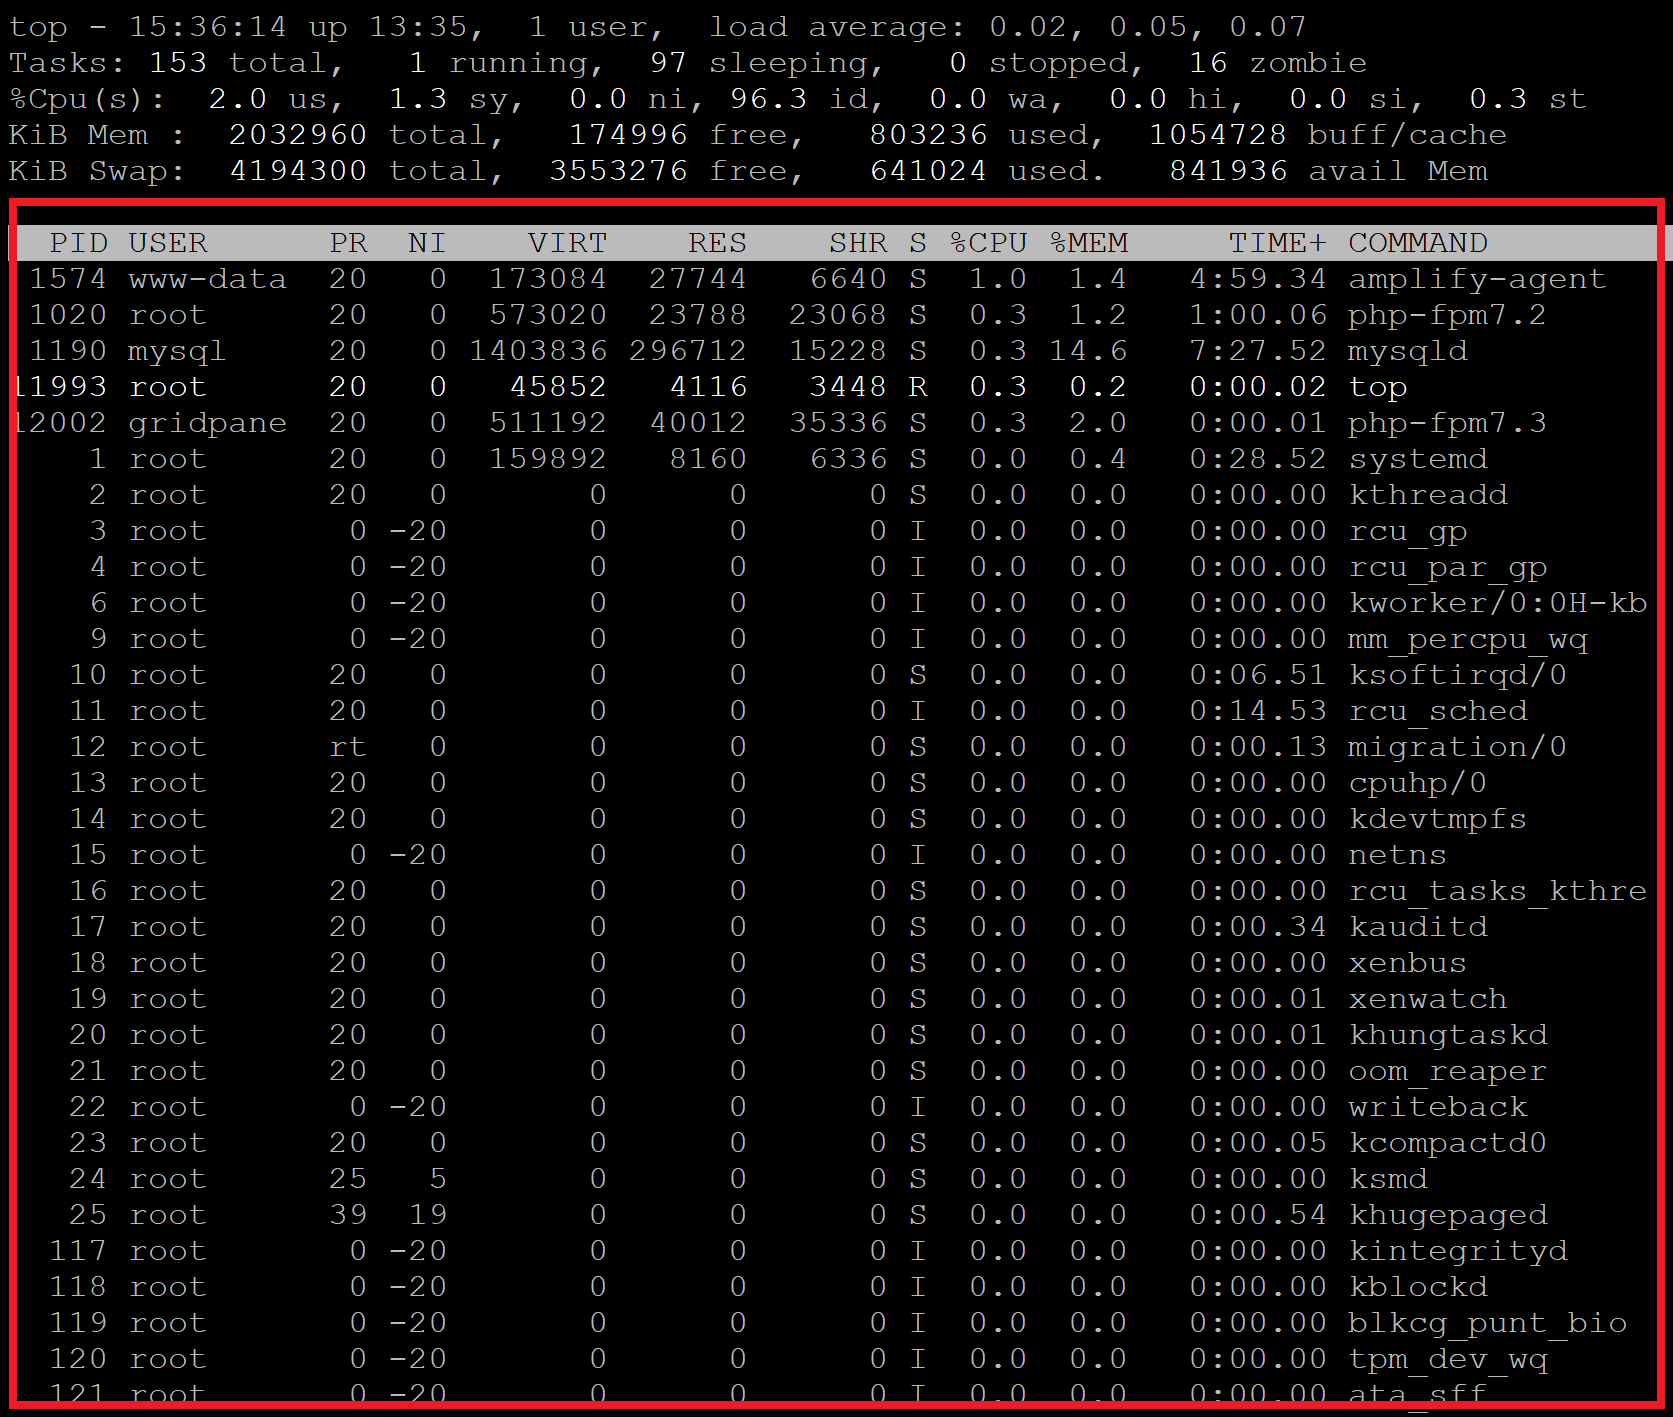
Top provides a dynamic and interactive view of running processes. You can see which processes are consuming the most CPU and memory. One standout feature is its ability to sort processes by different metrics. By default, processes are sorted by CPU usage, but with a simple keystroke, you can sort by memory or process ID. Additionally, Top allows you to send signals to processes, such as killing a rogue process that’s hogging resources. This makes it a powerful tool for managing system performance. ###Analyzing Output
The output of Top might seem overwhelming at first, but breaking it down helps. The first few lines show an overview of your system’s uptime, tasks, CPU usage, and memory usage. Below that, you’ll see a list of processes. Each column provides specific information, like the process ID (PID), user, CPU and memory usage, and command name. Consider focusing on the %CPU and %MEM columns. If you notice a process consistently using excessive resources, it might be worth investigating further. Could Top become your go-to tool for performance monitoring? With its straightforward interface and powerful features, it just might. Try it out the next time your system feels sluggish, and you may find it offers exactly the insights you need.Exploring Htop
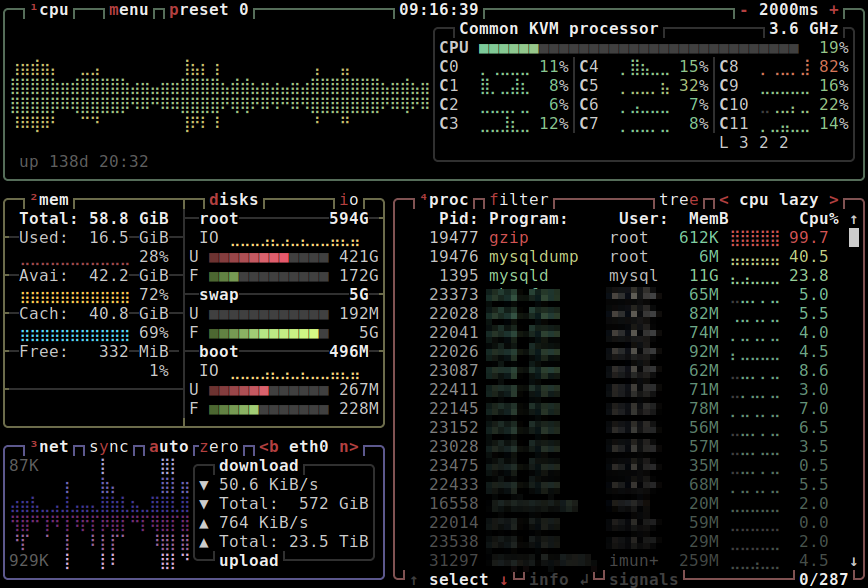
Linux users often seek effective tools for monitoring system resources. Htop offers a powerful alternative to the traditional ‘top’ command. It’s user-friendly and visually appealing. Htop allows users to delve deeper into system performance. Explore advanced features, customize the interface, and enjoy real-time monitoring.
Advanced Features
Htop provides detailed insights into system processes. Users can view CPU usage for each core. Memory consumption is displayed in a clear format. Users can sort processes by various criteria. Sorting by CPU or memory usage is simple. Htop supports process management functions. Users can easily send signals to processes.
Customizing Interface
Htop allows interface customization to suit user needs. Users can change the display colors. Altering the column layout is straightforward. Choose which system metrics to display. Customize the sort order of processes. Tailor the interface for optimal monitoring. Adjust settings for a personalized view.
Real-time Monitoring
Htop excels in real-time performance monitoring. Users see immediate updates on system resources. CPU, memory, and swap usage are visible instantly. Process changes reflect quickly on the screen. Real-time monitoring aids in quick decision-making. Identify resource hogs swiftly with real-time data.
Getting Started With Glances
Glances is a powerful tool for monitoring system resources in Linux. It provides a comprehensive view of system performance. Beginners will find it easy to use. It offers detailed insights into CPU, memory, disk, and network usage. Glances also supports plugins and a web interface. These features enhance its functionality. Here’s how you can get started with Glances.
Simple Setup
Installing Glances is straightforward. Use the package manager suitable for your Linux distribution. For Ubuntu, open the terminal and type sudo apt-get install glances. This command installs Glances quickly. Once installed, type glances in the terminal. The tool will display a real-time overview of system metrics.
Expandable Plugins
Glances supports various plugins. These plugins extend its monitoring capabilities. To enable a plugin, edit the glances.conf file. Customize the plugins according to your needs. Available plugins cover areas like system health and network connections. Plugins enhance the tool’s flexibility and usefulness.
Web Interface
Accessing Glances via a web interface is simple. Run Glances with the --web flag to start the server. Open a web browser and enter http://localhost:61208. This interface shows all system statistics. It’s user-friendly and accessible from any device on the network.
Benefits Of Sysstat
Sysstat offers a comprehensive suite of tools for Linux system monitoring. It efficiently tracks CPU, memory, and disk usage, providing detailed insights into resource allocation. Users can easily identify performance bottlenecks, ensuring smooth system operations.
Monitoring system resources in Linux is a crucial task for anyone keen on optimizing their system’s performance. Among the many tools available, Sysstat stands out for its comprehensive capabilities. Sysstat offers a suite of utilities that help you gather, analyze, and report on system performance statistics. But what exactly makes Sysstat beneficial for Linux users? ###Comprehensive Reports
Sysstat provides detailed reports on various system metrics such as CPU usage, disk activity, and network throughput. With these insights, you can easily identify which processes are consuming the most resources. This can be especially useful when your system feels sluggish and you need to pinpoint the bottleneck. The reports are clear and well-structured, making it easy for both beginners and experts to understand. Whether you’re managing a server farm or just a single machine, these reports can save you a lot of troubleshooting time. ###Scheduling Data Collection
One of the standout features of Sysstat is its ability to schedule data collection automatically. You can set it up to collect data at regular intervals, ensuring that you never miss critical information. This is particularly useful if you’re managing multiple systems and can’t manually check each one. Imagine you’re out of the office and a problem arises; with scheduled data collection, you’ll have historical data to review, making problem-solving much easier. Have you ever faced a system crash and wished you had more data to figure out what went wrong? Sysstat’s scheduling feature can be a lifesaver in those scenarios. ###Long-term Analysis
Sysstat excels in providing long-term analysis of system performance. By storing historical data, it allows you to track trends over time. This can help you forecast future resource needs and plan for upgrades. For instance, if you notice a consistent increase in CPU usage over several months, you might decide it’s time to upgrade your hardware. Long-term analysis can also help you evaluate the impact of changes, like software updates or new configurations. What trends have you noticed in your system performance over time? Sysstat can help you answer that. Sysstat is not just a tool but a valuable companion in maintaining a healthy Linux environment. By offering comprehensive reports, flexible scheduling, and long-term insights, it empowers you to make informed decisions about your system’s resources.Monitoring With Netdata
Monitoring system resources in Linux can be daunting, but tools like Netdata make it manageable and even enjoyable. Netdata offers a real-time monitoring solution that provides comprehensive insights into your system’s performance. It’s not just about numbers; it gives you a vivid picture of what’s happening on your system. Let’s explore how Netdata can transform your monitoring experience with its visual dashboard, alert system, and scalability features.
Visual Dashboard
Imagine having a dynamic dashboard that showcases your system’s performance with detailed graphs and charts. Netdata’s visual dashboard is like having a window into your system’s soul. You can watch CPU usage, memory, disk activity, and network traffic unfold in real time.
When I first started using Netdata, the immediate feedback from the visual dashboard helped me pinpoint issues faster than ever before. It was like having my personal assistant highlighting what needed attention.
Have you ever wished for a clearer picture of your system’s health? This dashboard is your answer.
Alert System
Netdata doesn’t just show you data; it speaks to you through alerts. Its alert system is designed to notify you when your system metrics cross predefined thresholds. This feature is essential for preventing unexpected downtimes.
Once, I received an alert about high memory usage right before a critical deployment. Thanks to Netdata, I addressed the issue before it escalated, saving valuable time and resources.
Are you ready to have your system’s heartbeat at your fingertips?
Scalability Features
Netdata is built to scale, handling everything from a single server to complex infrastructures. Its scalability features mean you can monitor multiple systems without losing performance or detail. This makes it ideal for growing businesses.
In a project where I needed to monitor dozens of servers, Netdata’s scalability was a game changer. It seamlessly integrated into our infrastructure, providing consistent and reliable data.
How will scaling your monitoring solution impact your business growth? Netdata might be the key.
By leveraging Netdata, you’re not just monitoring; you’re gaining control and insight into your system’s operations. Whether you’re a seasoned sysadmin or a curious newbie, Netdata offers the tools to keep your system running smoothly. Ready to take the leap?
Choosing The Right Tool
Selecting the right tool is crucial for monitoring Linux system resources. Tools like Top, Htop, and Free help track system performance efficiently. They offer clear insights into CPU usage, memory consumption, and process management.
Monitoring system resources in Linux is essential for maintaining optimal performance. With tools like Top, Htop, and Free at your disposal, choosing the right one can seem daunting. The key is to match the tool to your specific needs. This section will help you make an informed decision by focusing on performance needs, ease of use, and integration capabilities.Performance Needs
Determining your performance needs is crucial. Are you managing a server farm or a personal laptop? For heavy-duty monitoring, Top provides comprehensive insights into CPU and memory usage. It helps you identify resource hogs quickly. If you’re after more detailed analysis, Htop adds color-coded metrics and visual graphs for a clearer picture. On the other hand, Free is perfect for checking memory usage at a glance. It’s lightweight and quick, ideal for users who need basic information without any frills.Ease Of Use
Navigating through these tools should be intuitive. If you prefer a simple command-line interface, Free is straightforward and easy to remember. Top is slightly more complex but offers real-time updates with minimal commands. It’s beneficial for users who are comfortable with command-line navigation but want live data. Htop shines with its user-friendly interface. It allows you to scroll through processes, kill tasks directly, and customize the display to your liking. This makes it accessible even to those new to Linux.Integration Capabilities
Consider how well each tool integrates into your existing workflow. Do you need to export data for analysis or integrate it into scripts? Top can be redirected to output logs for later review, making it handy for ongoing monitoring tasks. If you’re looking for real-time integration with other applications, Htop supports both interactive and scriptable interfaces. This flexibility can enhance automation processes. Free, while limited in direct integration capabilities, still provides quick snapshots that can be easily piped into scripts for basic monitoring. Its simplicity makes it a reliable part of any quick-check routine. When choosing your tool, think about how it fits into your daily tasks. Which tool aligns best with your skill level and requirements? By understanding what each tool offers, you can select the one that will make your Linux experience more efficient and enjoyable.
Credit: www.geeksforgeeks.org
Best Practices For Resource Monitoring
Monitoring system resources in Linux is crucial for maintaining performance and preventing overloads. By consistently checking your system’s health, you can ensure that your applications run smoothly. But what are the best practices for effective resource monitoring?
Regular Checks
Conducting regular checks on your system is like giving your car a routine tune-up. Frequent monitoring helps you catch issues before they become problems. Set aside time daily or weekly to review your system’s performance using tools like top, htop, and free. This habit keeps you informed about your system’s behavior.
Consider the time when I noticed my server’s CPU usage spiking unexpectedly. Regular checks allowed me to identify and address the issue before it affected my users. By routinely examining CPU, memory, and swap space, you can maintain optimal system health.
Automating Alerts
Why wait for a system crash when you can automate alerts? Tools like Nagios or Zabbix can notify you when your system’s resources exceed set thresholds. This proactive approach saves time and prevents downtime.
Imagine receiving an alert about high memory usage while you’re enjoying a weekend getaway. Thanks to automated alerts, you can address issues promptly without constantly monitoring your system. Set alerts for CPU, memory, and disk usage to stay ahead of potential problems.
Data Interpretation
Monitoring data is useless if you can’t interpret it. Understanding what resource metrics mean is key to effective monitoring. For example, if your swap usage is consistently high, it might indicate insufficient RAM.
Take my experience with high disk usage: initially, it seemed alarming, but upon closer inspection, it was due to regular backups. Learning to interpret data correctly helps you differentiate between normal and abnormal patterns. Ask yourself, “What does this data tell me about my system’s performance?”
Resource monitoring is not just about gathering data; it’s about understanding it. Use regular checks, automate alerts, and interpret data wisely to keep your Linux system running smoothly. Are you ready to take control of your system’s health?
Frequently Asked Questions
How To Monitor System Processes Using Htop Command?
Use the htop command in the terminal to monitor system processes. Launch it by typing htop and pressing Enter. Navigate with arrow keys to view CPU, memory usage, and process details. Press F10 to exit.
How To Check System Resource Usage In Linux?
Use the top or htop command in the terminal to check system resource usage. The vmstat command provides detailed resource stats. For disk usage, use df -h. To monitor memory usage, use free -m. These commands offer real-time insights into your Linux system’s performance.
How To Check Current Running Process & System Status Ps Top Sar?
Use ps to list current processes. Run top for real-time system status. Use sar for historical performance data.
How To Monitor System Performance In Linux?
Use tools like top, htop, or glances to monitor Linux system performance. Check CPU, memory, and disk usage. Utilize iostat, vmstat, and netstat for detailed statistics. Install monitoring software like Nagios or Zabbix for advanced analysis. Regularly review logs for anomalies and optimize system resources accordingly.
Conclusion
Monitoring system resources in Linux is essential. Tools like Top, Htop, and Free make this task simple. Top provides a quick overview. Htop offers an interactive interface. Free shows memory usage clearly. Each tool has its strengths. Choose based on your needs.
Regular monitoring helps maintain system health. It improves performance too. Start exploring these tools today. Keep your Linux system running smoothly. Happy monitoring!
-

 DevOps6 years ago
Saltstack Tutorial for beginners [2025]
-

 DevOps6 years ago
How to build a Docker cron job Container easily [2025]
-

 Linux7 years ago
mail Command in Linux/Unix with 10+ Examples [2025]
-

 DevOps7 years ago
Docker ADD vs COPY vs VOLUME – [2025]
-
 DevOps6 years ago
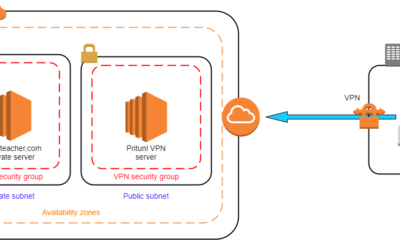
How to setup Pritunl VPN on AWS to Access Servers
-

 Linux7 years ago
Grep Command In Unix/Linux with 25+ Examples [2025]
-

 Linux7 years ago
Find command in Unix/Linux with 30+ Examples [2025]
-
Linux6 years ago
How To setup Django with Postgres, Nginx, and Gunicorn on Ubuntu 20.04